
Quickstart
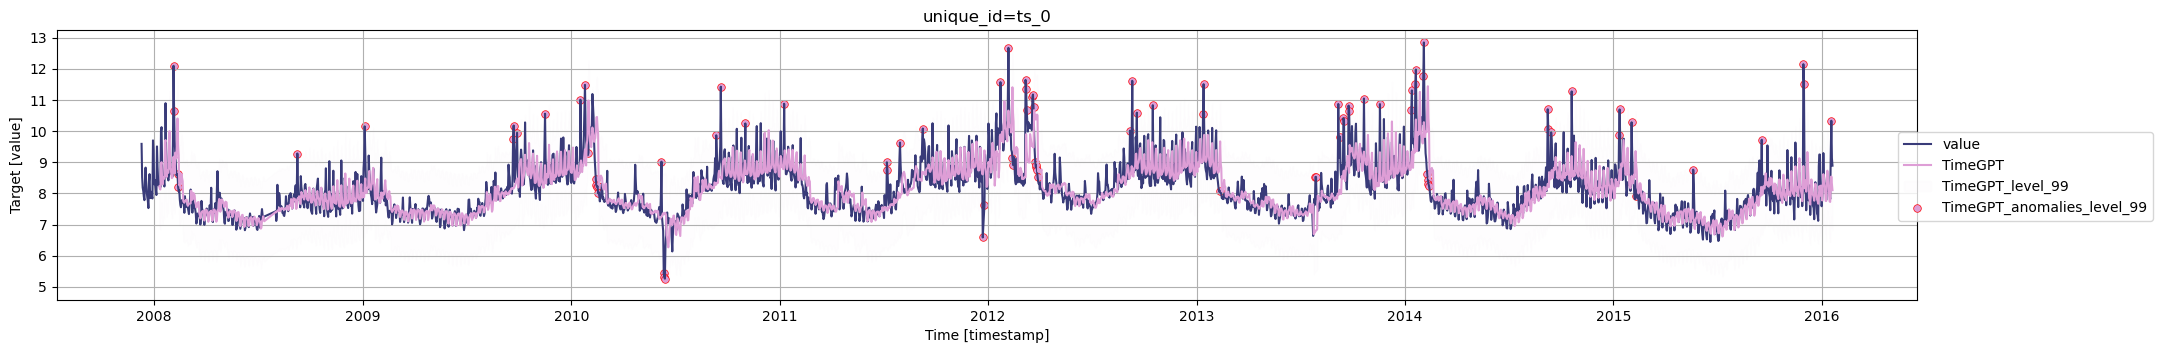
To perform anomaly detection, use the detect_anomalies method. Then, plot the anomalies using the plot method.
![]()
import pandas as pd
from nixtla import NixtlaClient
nixtla_client = NixtlaClient(
    # defaults to os.environ.get("NIXTLA_API_KEY")
    api_key = 'my_api_key_provided_by_nixtla'
)
Use an Azure AI endpoint
To use an Azure AI endpoint, set the
base_urlargument:
nixtla_client = NixtlaClient(base_url="you azure ai endpoint", api_key="your api_key")
# Read the dataset
df = pd.read_csv('https://datasets-nixtla.s3.amazonaws.com/peyton-manning.csv')

# Detect anomalies
anomalies_df = nixtla_client.detect_anomalies(df, freq='D')

# Plot anomalies
nixtla_client.plot(df, anomalies_df)
INFO:nixtla.nixtla_client:Validating inputs...
INFO:nixtla.nixtla_client:Preprocessing dataframes...
INFO:nixtla.nixtla_client:Calling Anomaly Detector Endpoint...
Available models in Azure AI
If you use an Azure AI endpoint, set
model="azureai"
nixtla_client.detect_anomalies(..., model="azureai")For the public API, two models are supported:
timegpt-1andtimegpt-1-long-horizon.By default,
timegpt-1is used. See this tutorial for details on usingtimegpt-1-long-horizon.
For an in-depth guide on anomaly detection with TimeGPT, check out our tutorial.
Updated 3 months ago