
Anomaly detection
Anomaly detection is task of detecting abnormal points, points that deviate from the normal behaviour of the general series. This is crucial in many application, such as cybersecurity or equipment monitoring.
In this tutorial, we explore in detail the anomaly detection capability of TimeGPT.
![]()
Import packages
First, we import the required packages for this tutorial and create an instance of NixtlaClient.
import pandas as pd
from nixtla import NixtlaClient
nixtla_client = NixtlaClient(
    # defaults to os.environ.get("NIXTLA_API_KEY")
    api_key = 'my_api_key_provided_by_nixtla'
)
Use an Azure AI endpoint
To use an Azure AI endpoint, set the
base_urlargument:
nixtla_client = NixtlaClient(base_url="you azure ai endpoint", api_key="your api_key")
Load dataset
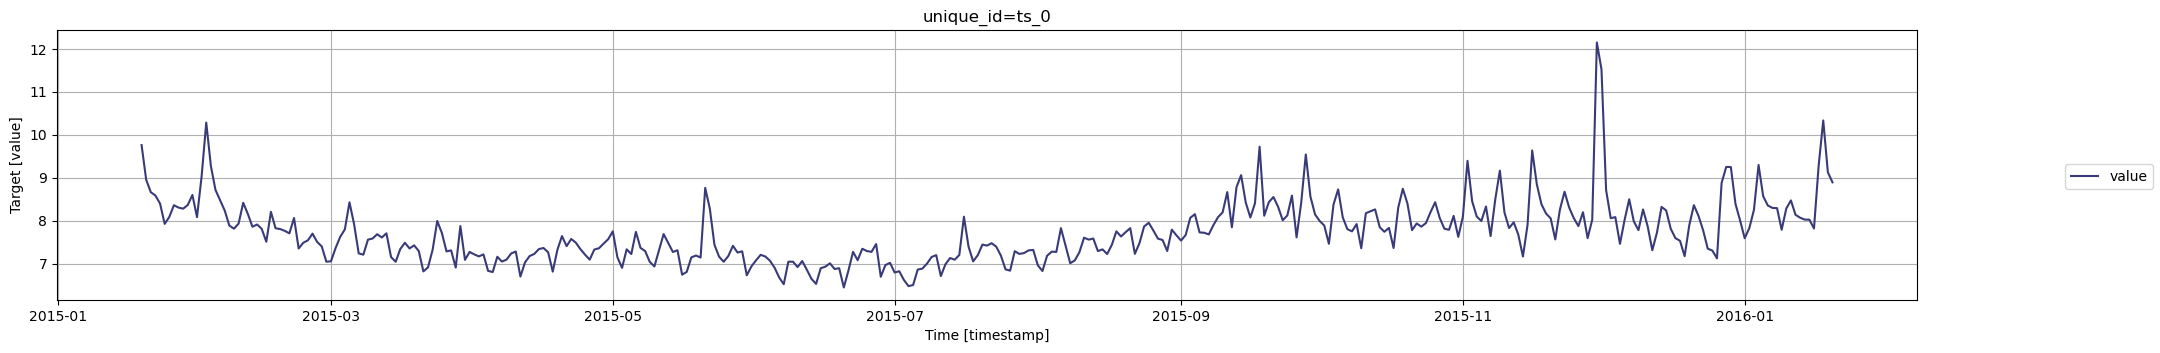
Now, let’s load the dataset for this tutorial. We use the Peyton Manning dataset which tracks the visits to the Wikipedia page of Peyton Mannig.
df = pd.read_csv('https://datasets-nixtla.s3.amazonaws.com/peyton-manning.csv')
df.head()
| unique_id | ds | y | |
|---|---|---|---|
| 0 | 0 | 2007-12-10 | 9.590761 |
| 1 | 0 | 2007-12-11 | 8.519590 |
| 2 | 0 | 2007-12-12 | 8.183677 |
| 3 | 0 | 2007-12-13 | 8.072467 |
| 4 | 0 | 2007-12-14 | 7.893572 |
nixtla_client.plot(df, max_insample_length=365)
Anomaly detection
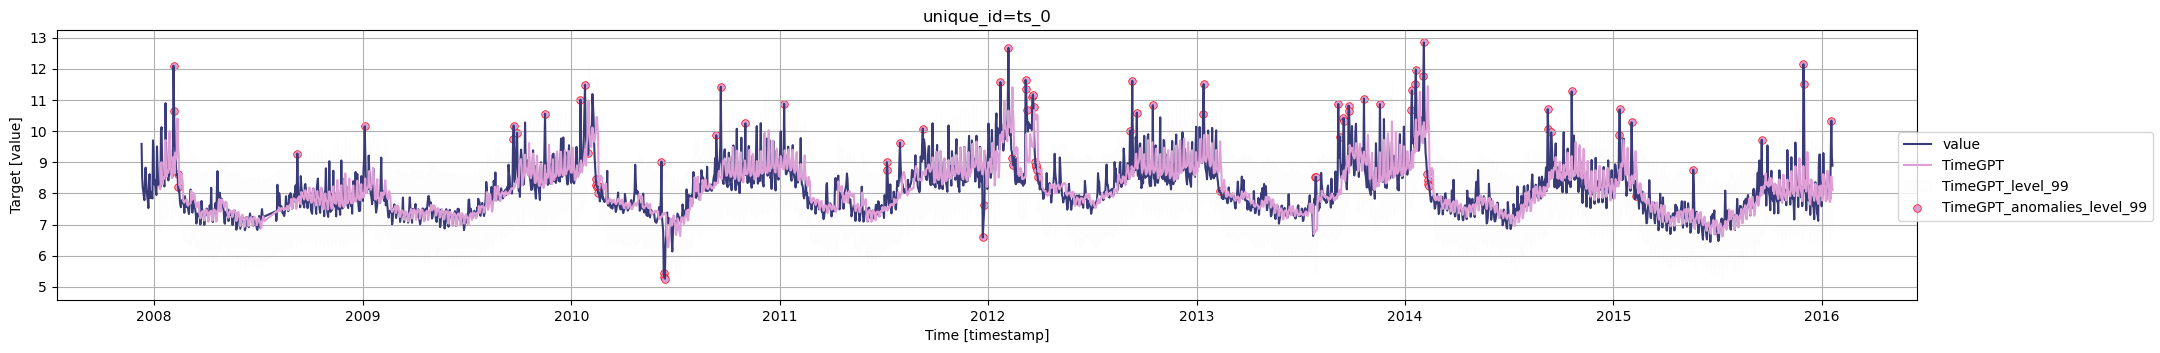
We now perform anomaly detection. By default, TimeGPT uses a 99% confidence interval. If a point falls outisde of that interval, it is considered to be an anomaly.
anomalies_df = nixtla_client.detect_anomalies(df, freq='D')
anomalies_df.head()
INFO:nixtla.nixtla_client:Validating inputs...
INFO:nixtla.nixtla_client:Querying model metadata...
INFO:nixtla.nixtla_client:Preprocessing dataframes...
INFO:nixtla.nixtla_client:Calling Anomaly Detector Endpoint...
| unique_id | ds | y | TimeGPT | TimeGPT-hi-99 | TimeGPT-lo-99 | anomaly | |
|---|---|---|---|---|---|---|---|
| 0 | 0 | 2008-01-10 | 8.281724 | 8.224187 | 9.503586 | 6.944788 | False |
| 1 | 0 | 2008-01-11 | 8.292799 | 8.151533 | 9.430932 | 6.872135 | False |
| 2 | 0 | 2008-01-12 | 8.199189 | 8.127243 | 9.406642 | 6.847845 | False |
| 3 | 0 | 2008-01-13 | 9.996522 | 8.917259 | 10.196658 | 7.637861 | False |
| 4 | 0 | 2008-01-14 | 10.127071 | 9.002326 | 10.281725 | 7.722928 | False |
Available models in Azure AI
If you are using an Azure AI endpoint, please be sure to set
model="azureai":
nixtla_client.detect_anomalies(..., model="azureai")For the public API, we support two models:
timegpt-1andtimegpt-1-long-horizon.By default,
timegpt-1is used. Please see this tutorial on how and when to usetimegpt-1-long-horizon.
As you can see, False is assigned to “normal” values, as they fall inside the confidence interval. A label of True is then assigned to abnormal points.
We can also plot the anomalies using NixtlaClient.
nixtla_client.plot(df, anomalies_df)
Anomaly detection with exogenous features
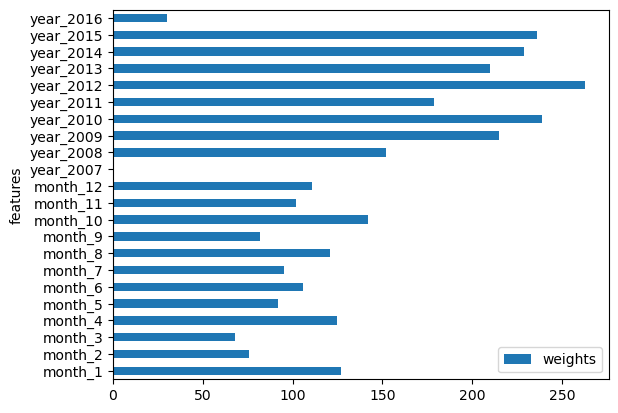
Previously, we performed anomaly detection without using any exogenous features. Now, it is possible to create features specifically for this scenario to inform the model in its task of anomaly detection.
Here, we create date features that can be used by the model.
This is done using the date_features argument. We can set it to True and it will generate all possible features from the given dates and frequency of the data. Alternatively, we can specify a list of features that we want. In this case, we want only features at the month and year level.
anomalies_df_x = nixtla_client.detect_anomalies(
    df,
    freq='D',
    date_features=['month', 'year'],
    date_features_to_one_hot=True,
)
INFO:nixtla.nixtla_client:Validating inputs...
INFO:nixtla.nixtla_client:Preprocessing dataframes...
INFO:nixtla.nixtla_client:Using the following exogenous features: ['month_1.0', 'month_2.0', 'month_3.0', 'month_4.0', 'month_5.0', 'month_6.0', 'month_7.0', 'month_8.0', 'month_9.0', 'month_10.0', 'month_11.0', 'month_12.0', 'year_2007.0', 'year_2008.0', 'year_2009.0', 'year_2010.0', 'year_2011.0', 'year_2012.0', 'year_2013.0', 'year_2014.0', 'year_2015.0', 'year_2016.0']
INFO:nixtla.nixtla_client:Calling Anomaly Detector Endpoint...
Then, we can plot the detected anomalies where the model now used additional information from exogenous features.
nixtla_client.plot(df, anomalies_df_x)
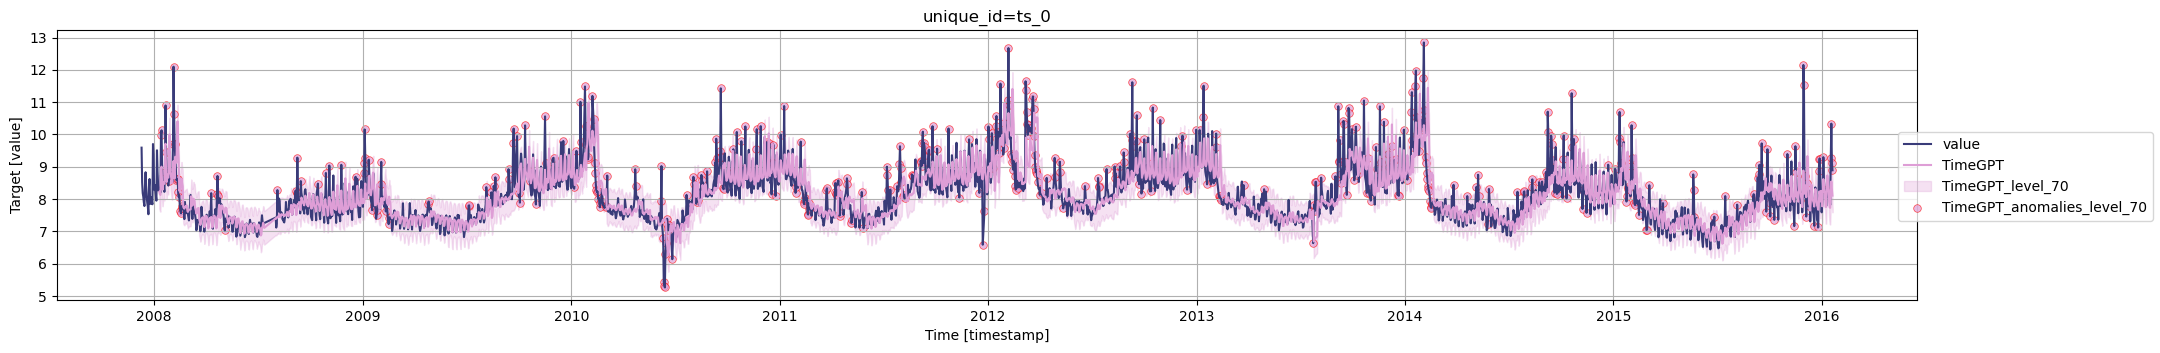
Modifying the confidence intervals
We can tweak the confidence intervals using the level argument. This takes any values between 0 and 100, including decimal numbers.
Reducing the confidence interval resutls in more anomalies being detected, while increasing it will reduce the number of anomalies.
Here, for example, we reduce the interval to 70%, and we will notice more anomalies being plotted (red dots).
anomalies_df = nixtla_client.detect_anomalies(
    df,
    freq='D',
    level=70
)
INFO:nixtla.nixtla_client:Validating inputs...
INFO:nixtla.nixtla_client:Preprocessing dataframes...
INFO:nixtla.nixtla_client:Calling Anomaly Detector Endpoint...
nixtla_client.plot(df, anomalies_df)
Updated 3 months ago