
Prediction intervals
In forecasting, we are often interested in a distribution of predictions rather than only a point prediction, because we want to have a notion of the uncertainty around the forecast.
To this end, we can create prediction intervals.
Prediction intervals have an intuitive interpretation, as they present a specific range of the forecast distribution. For instance, a 95% prediction interval means that 95 out of 100 times, we expect the future value to fall within the estimated range. Therefore, a wider interval indicates greater uncertainty about the forecast, while a narrower interval suggests higher confidence.
With TimeGPT, we can create a distribution of forecasts, and extract the prediction intervals for a required level.
TimeGPT uses conformal prediction to produce the prediction intervals.
![]()
1. Import packages
First, we import the required packages and initialize the Nixtla client
import pandas as pd
from nixtla import NixtlaClient
nixtla_client = NixtlaClient(
    # defaults to os.environ.get("NIXTLA_API_KEY")
    api_key = 'my_api_key_provided_by_nixtla'
)
Use an Azure AI endpoint
To use an Azure AI endpoint, set the
base_urlargument:
nixtla_client = NixtlaClient(base_url="you azure ai endpoint", api_key="your api_key")
2. Load data
df = pd.read_csv('https://raw.githubusercontent.com/Nixtla/transfer-learning-time-series/main/datasets/air_passengers.csv')
df.head()
| timestamp | value | |
|---|---|---|
| 0 | 1949-01-01 | 112 |
| 1 | 1949-02-01 | 118 |
| 2 | 1949-03-01 | 132 |
| 3 | 1949-04-01 | 129 |
| 4 | 1949-05-01 | 121 |
3. Forecast with prediction intervals
When using TimeGPT for time series forecasting, you can set the level (or levels) of prediction intervals according to your requirements. Here’s how you could do it:
timegpt_fcst_pred_int_df = nixtla_client.forecast(
    df=df, h=12, level=[80, 90, 99.7],
    time_col='timestamp', target_col='value',
)
timegpt_fcst_pred_int_df.head()
INFO:nixtla.nixtla_client:Validating inputs...
INFO:nixtla.nixtla_client:Preprocessing dataframes...
INFO:nixtla.nixtla_client:Inferred freq: MS
INFO:nixtla.nixtla_client:Restricting input...
INFO:nixtla.nixtla_client:Calling Forecast Endpoint...
| timestamp | TimeGPT | TimeGPT-lo-99.7 | TimeGPT-lo-90 | TimeGPT-lo-80 | TimeGPT-hi-80 | TimeGPT-hi-90 | TimeGPT-hi-99.7 | |
|---|---|---|---|---|---|---|---|---|
| 0 | 1961-01-01 | 437.837952 | 415.826484 | 423.783737 | 431.987091 | 443.688812 | 451.892166 | 459.849419 |
| 1 | 1961-02-01 | 426.062744 | 402.833553 | 407.694092 | 412.704956 | 439.420532 | 444.431396 | 449.291935 |
| 2 | 1961-03-01 | 463.116577 | 423.434092 | 430.316893 | 437.412564 | 488.820590 | 495.916261 | 502.799062 |
| 3 | 1961-04-01 | 478.244507 | 444.885193 | 446.776764 | 448.726837 | 507.762177 | 509.712250 | 511.603821 |
| 4 | 1961-05-01 | 505.646484 | 465.736694 | 471.976787 | 478.409872 | 532.883096 | 539.316182 | 545.556275 |
Available models in Azure AI
If you are using an Azure AI endpoint, please be sure to set
model="azureai":
nixtla_client.forecast(..., model="azureai")For the public API, we support two models:
timegpt-1andtimegpt-1-long-horizon.By default,
timegpt-1is used. Please see this tutorial on how and when to usetimegpt-1-long-horizon.
nixtla_client.plot(
    df, timegpt_fcst_pred_int_df,
    time_col='timestamp', target_col='value',
    level=[80, 90],
)
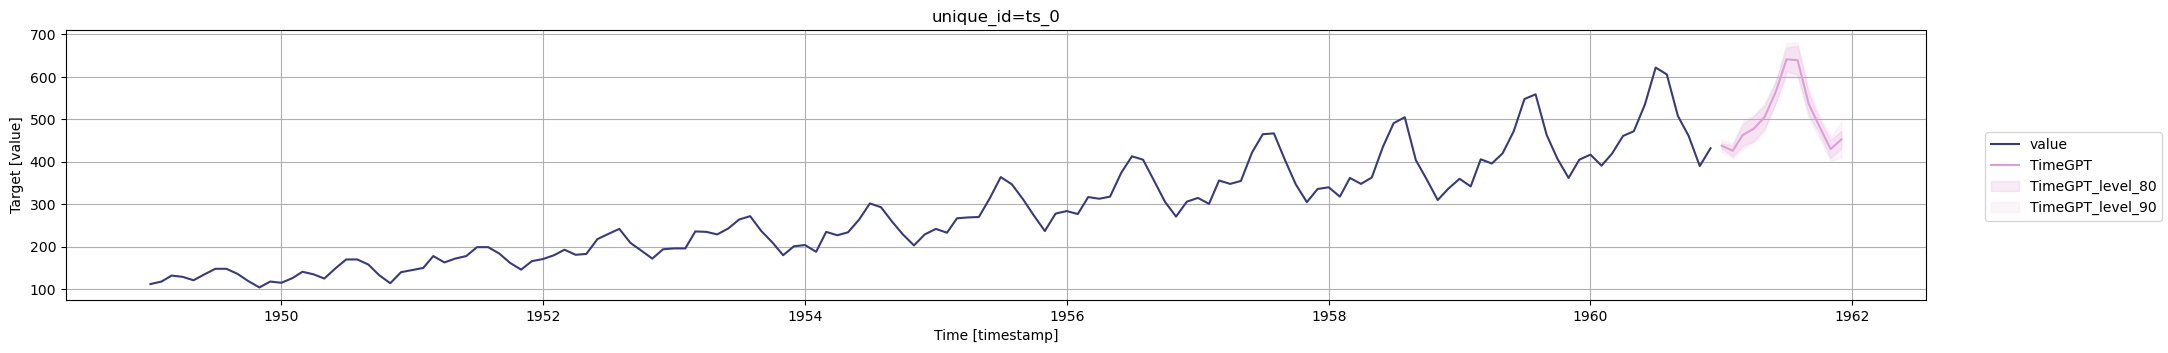
It’s essential to note that the choice of prediction interval level depends on your specific use case. For high-stakes predictions, you might want a wider interval to account for more uncertainty. For less critical forecasts, a narrower interval might be acceptable.
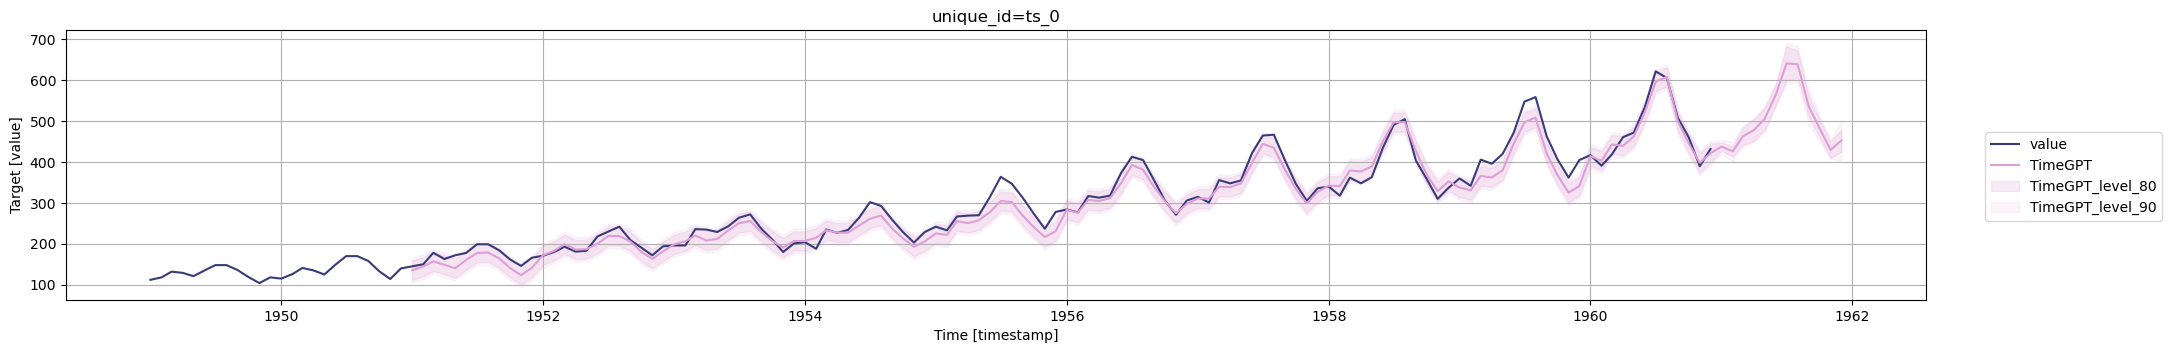
Historical Forecast
You can also compute prediction intervals for historical forecasts adding the add_history=True parameter as follows:
timegpt_fcst_pred_int_historical_df = nixtla_client.forecast(
    df=df, h=12, level=[80, 90],
    time_col='timestamp', target_col='value',
    add_history=True,
)
timegpt_fcst_pred_int_historical_df.head()
INFO:nixtla.nixtla_client:Validating inputs...
INFO:nixtla.nixtla_client:Preprocessing dataframes...
INFO:nixtla.nixtla_client:Inferred freq: MS
INFO:nixtla.nixtla_client:Calling Forecast Endpoint...
INFO:nixtla.nixtla_client:Calling Historical Forecast Endpoint...
| timestamp | TimeGPT | TimeGPT-lo-80 | TimeGPT-lo-90 | TimeGPT-hi-80 | TimeGPT-hi-90 | |
|---|---|---|---|---|---|---|
| 0 | 1951-01-01 | 135.483673 | 111.937767 | 105.262830 | 159.029579 | 165.704516 |
| 1 | 1951-02-01 | 144.442413 | 120.896508 | 114.221571 | 167.988319 | 174.663256 |
| 2 | 1951-03-01 | 157.191910 | 133.646004 | 126.971067 | 180.737815 | 187.412752 |
| 3 | 1951-04-01 | 148.769379 | 125.223473 | 118.548536 | 172.315284 | 178.990221 |
| 4 | 1951-05-01 | 140.472946 | 116.927041 | 110.252104 | 164.018852 | 170.693789 |
nixtla_client.plot(
    df, timegpt_fcst_pred_int_historical_df,
    time_col='timestamp', target_col='value',
    level=[80, 90],
)
Updated 3 months ago